How to Promote an Educational Side Project on Reddit
Example of how to promote an educational visualization on Reddit by posting in relevant subreddits, tailoring presentation, and making complex data relatable.
Reddit can be a powerful launchpad for educational side projects, especially those that turn complex data into clear, shareable visuals. Here’s how one creator did it with a US national debt explainer.
Algorithm:
- The creator built a website that scales US government finances — debt, revenue, spending, and budget cuts — down by a factor of 36 million to make them easier to understand.
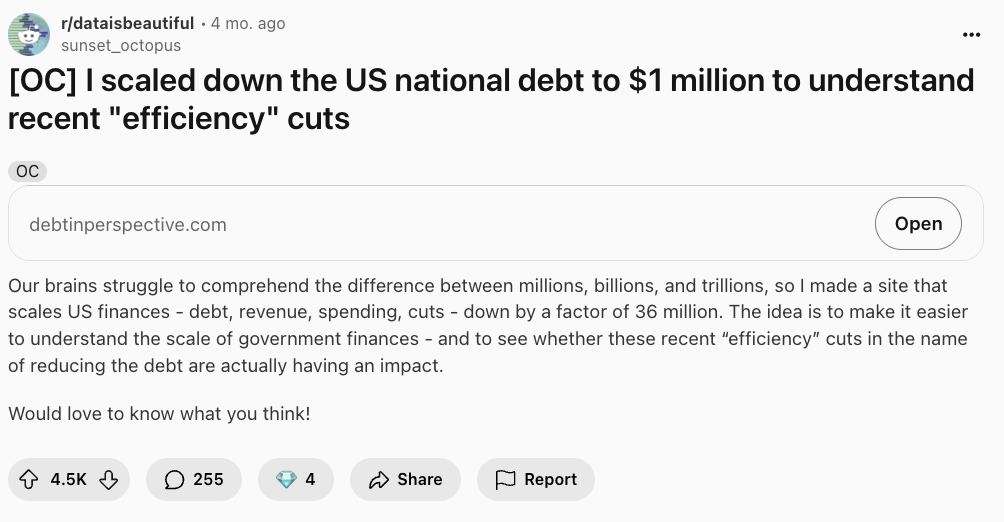
- They posted the project in r/dataisbeautiful, a community that thrives on high-quality data visualizations, with a clear and descriptive title: “[OC] I scaled down the US national debt to $1 million to understand recent ‘efficiency’ cuts.”
- The post included:
- A link to the interactive site
- A short explanation of why scaling was useful for comprehension
- A call for feedback from the community
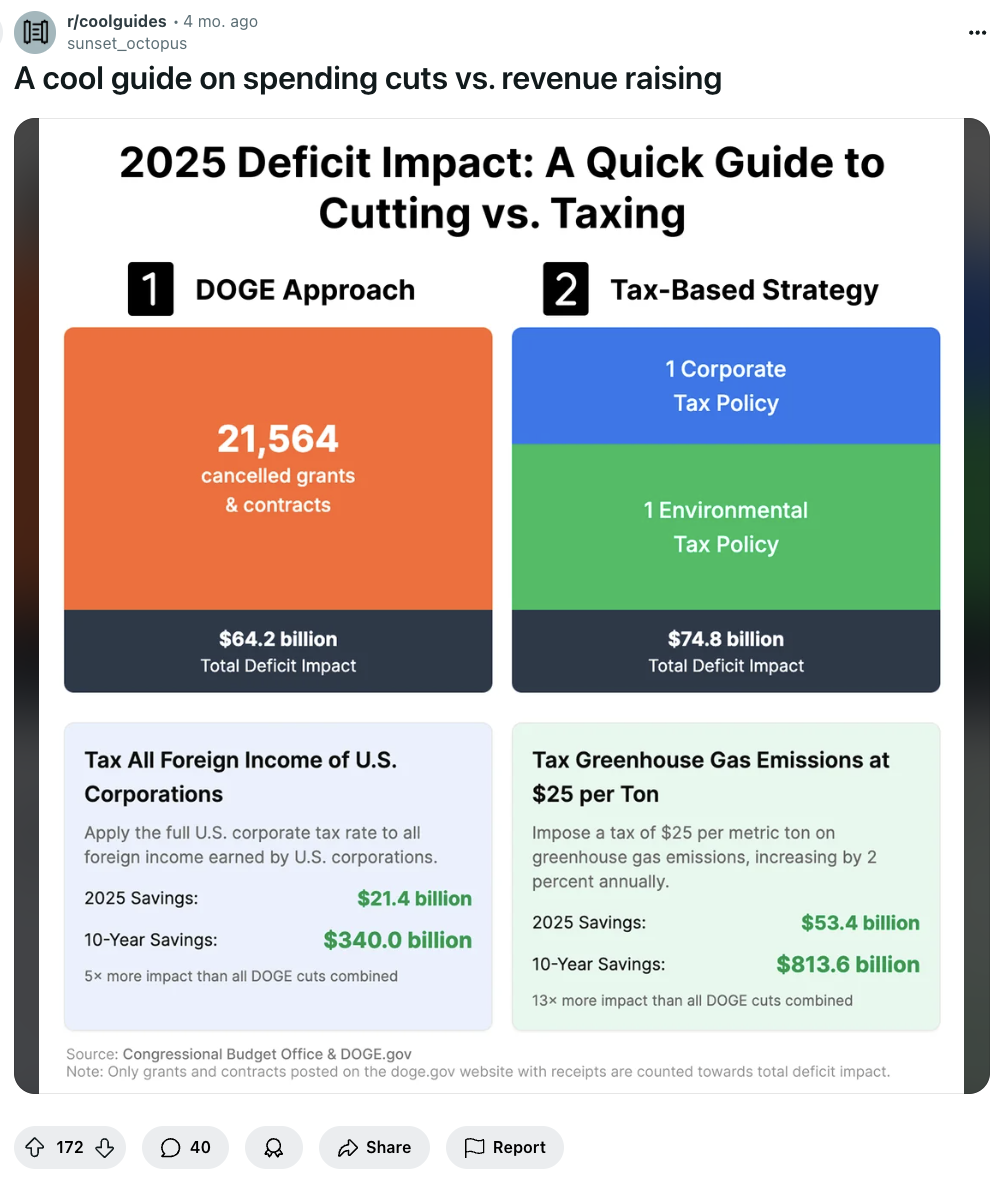
- The creator also cross-posted or reformatted the content for r/coolguides, framing it as a simple, helpful reference guide rather than a full visualization project.
- This approach allowed the project to reach multiple audience types — data visualization enthusiasts and those who enjoy quick, digestible educational content.
Why It Worked:
- The visualization tackled a timely and relevant topic — government budget cuts.
- Scaling large financial figures made them more relatable and discussion-friendly.
- Posting in two different communities maximized exposure while tailoring the presentation to each audience.
How to Scale This:
- Reframe the same data for different Reddit audiences — e.g., r/education, r/politics, r/infographics.
- Post follow-up versions that update the data as new government figures are released.
- Create similar visualizations for other countries’ budgets to attract an international audience.
Related Ideas:
- Turning scientific research into easy-to-read infographics for r/science and r/coolguides.
- Scaling environmental data for r/sustainability and r/dataisbeautiful.
- Breaking down corporate earnings or product pricing for consumer-focused subreddits.
This Is How It Looks Like
What users say
- “This really helps put the numbers in perspective.”
- “We need this kind of breakdown for more topics!”
By creating an engaging, educational visualization and strategically posting it in multiple relevant subreddits, the creator maximized reach and sparked meaningful discussion around a complex topic.
Final Notes
- Design visualizations that make abstract numbers concrete.
- Adjust your presentation to fit the subreddit’s style and culture.
- Cross-post or reframe for multiple audiences to extend your project’s lifespan.
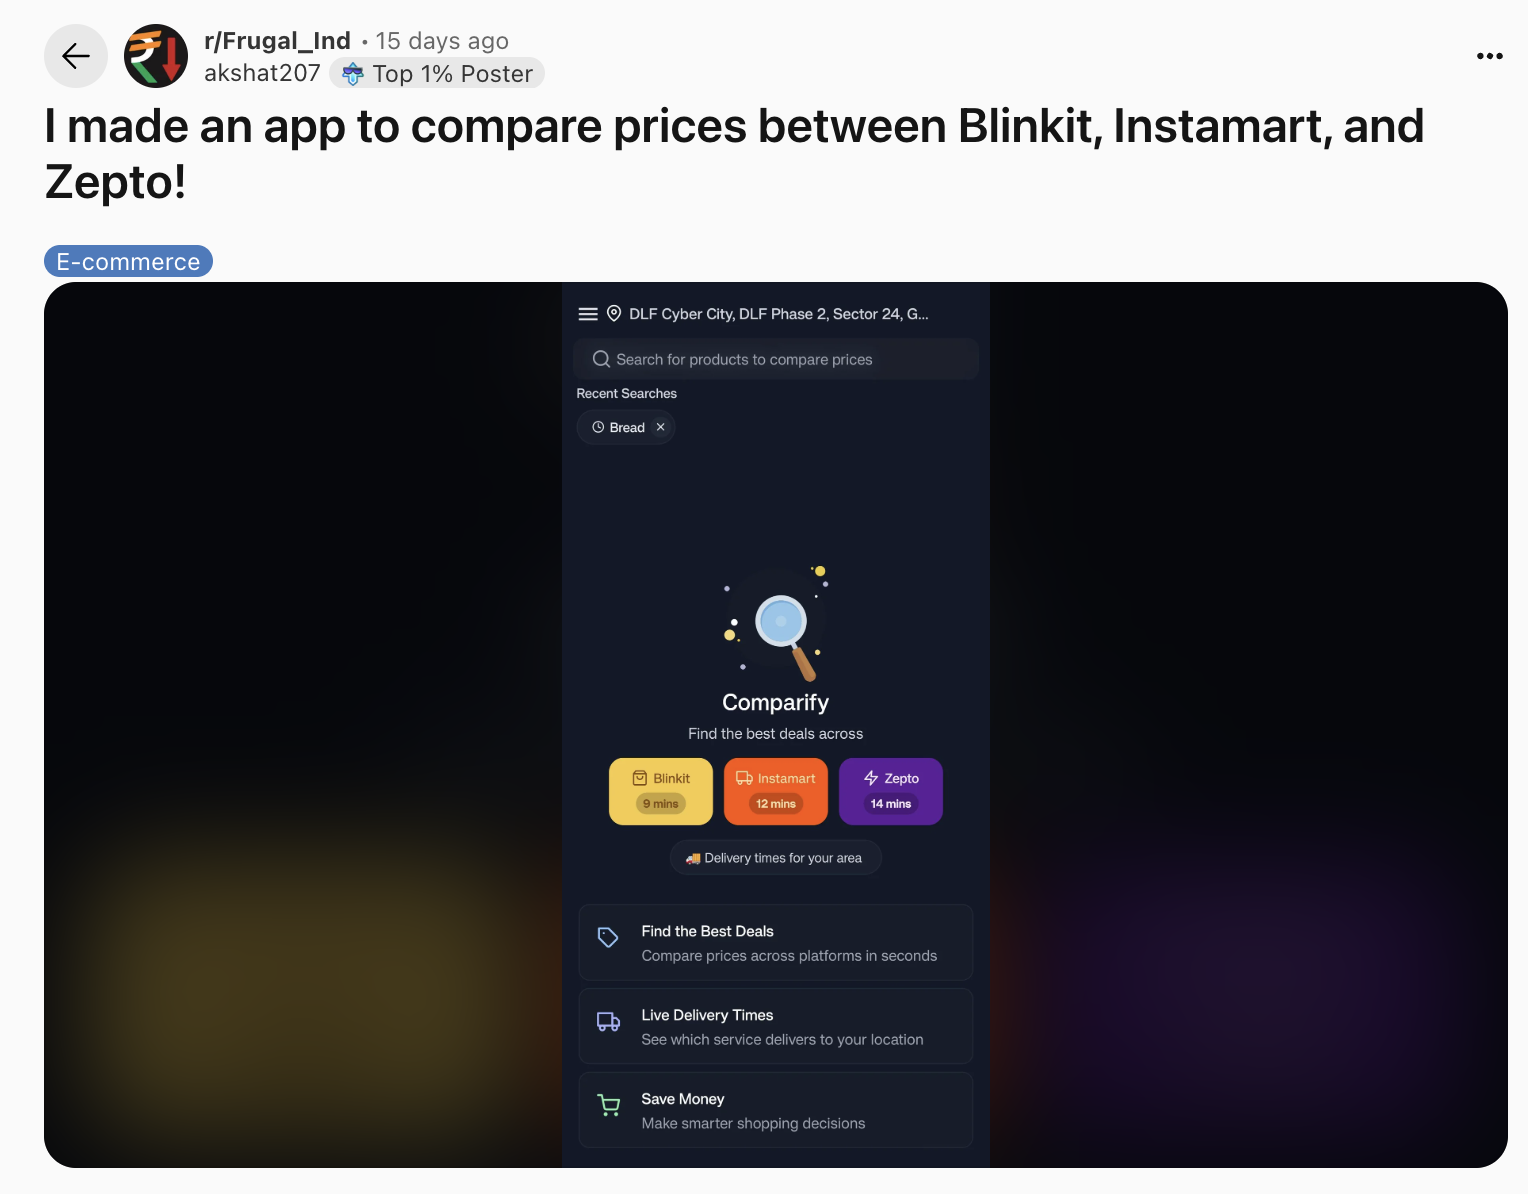
How to Promote a Price Comparison App on Reddit Organically
Price comparison apps are competitive, but smart targeting (like finding users seeking local deals) can make them stand out. Here’s a real example of how to promote such apps effectively on Reddit.
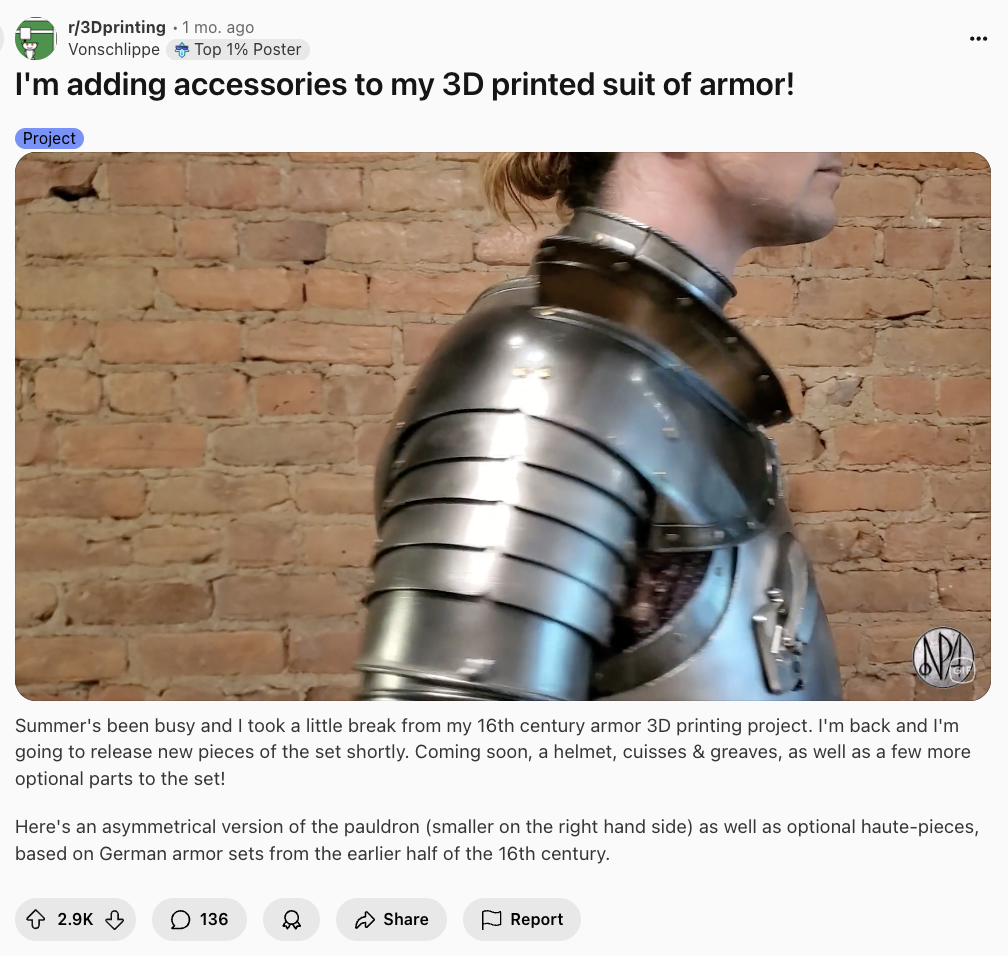
How to Promote Printable and Etsy Products on Reddit in Fan Communities
A 3D artist promoted his printable armor on Reddit by posting builds in maker and cosplay subs, engaging fans, and linking Etsy/Printables in comments.

How to boost social media for animators with Reddit organically
An animator grew his social media to 10k followers also by posting art in fan communities, promoting in comments, and cross-posting to related subreddits.